EDA of Murders in India
Being a populous country, and with a high level of poverty, it is no surprise that the crime rate is high in India. With data from 2001–2012, we can deep dive into many factors of crimes in India.
The dataset we have used contains complete information about various aspects of crimes happened in India from 2001 to 2010. There are many factors that can be analysed from this dataset. Over all, I hope this dataset helps us to understand better about India. The objective of this notebook is to see the trend of murder victims over the years as well as murder victims per state.
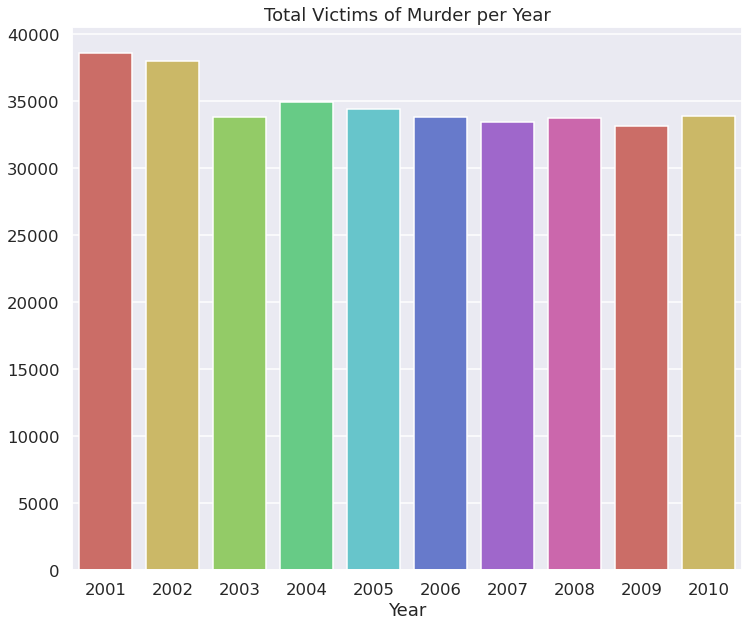
Compared to people of other ages the age group 18 - 30 years is more prone to be victim of the murder. The rise in 2002 numbers is maybe due to the riots of gujrat . Another age group which is most likely to be victim of murder is 30 - 50. Compared to these two groups other age groups are very small in number. From all the groups children are most likely to be safe. With almost 60000 murders Uttarpradesh has highest victims of murder. Bihar has second highest number of victims which has less than 25000 victims than Uttarpradesh. Interestingly Uttarpradesh has the highest population in the country. Bihar has less population than maharashtra still it has higher number of victims than Maharashtra. Union Territory Lakshadweep has lowest number of Murder Victims. Factors like population of the state and Population density might be responsible for the number of murder victims in the state.
Conclusion
Although country level murder rate is decreasing slowly over the years. State like Uttarpradesh , Bihar , Mahrashtra , West Bengal has the high number of victims over the years. The male age group of 18-30 is most unsafe. So if you belong to this age group Be Safe.